
This article was originally published on Ales Nosek - The Software Practitioner.
In the previous entry to this series, we reviewed several techniques that help you to prevent event loop delays. However, even the best programmer makes mistakes. What should you do when your Vert.x application doesn’t perform as expected? How to find out what part of your code is blocking the event loop threads? In the final part of the series, we are going to focus on troubleshooting event loop delays.
The event loop thread model is vastly different from the thread-per-request model employed by standard JEE or Spring frameworks. From my experience I can report that it takes developers some time to wrap their heads around it and that at the beginning they tend to make the mistake of introducing blocking calls into the event loop’s code path. In the following sections, we will discuss several techniques of how to troubleshoot such situations.
Blocked thread checker
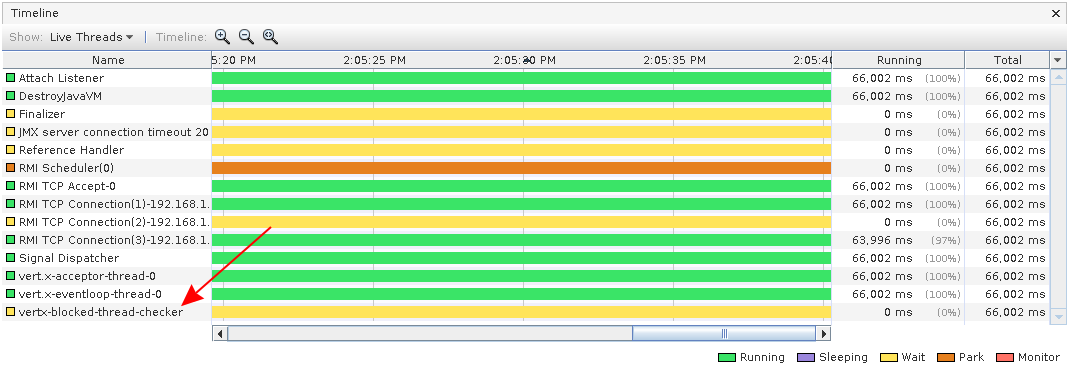
Vert.x comes with a built-in mechanism to detect delays on event loop and worker threads by checking the execution time of handlers that you registered with the Vert.x APIs. This mechanism operates in two steps. In the first step, Vert.x saves the timestamp of the moment when a handler starts executing. This start timestamp is saved to a storage attached to the thread that is executing the handler. Whenever the execution of the handler has completed the timestamp is reset. In the second step, Vert.x periodically checks the timestamps using a dedicated thread called vertx-blocked-thread-checker. This thread is spawned by Vert.x during the creation of the Vert.x instance for example when you call Vertx.vertx(). The vertx-blocked-thread-checker thread can be seen in VisualVM:
The blocked thread checker serves as a watchdog that periodically checks the Vert.x threads. It iterates over all Vert.x threads and for each thread it subtracts the threads start timestamp from the current time to compute how long the thread has already been executing the handler code. If the execution time exceeds the specified threshold a warning message is dropped into the logs:
1 2 3 4 5 6 7 8 9 10 11 12 13 14 |
|
You can use grep to routinely search through your application logs for this message. Vert.x can also log the entire stack trace to help you pinpoint the location in your code where your handler is blocking the thread:
1 2 3 4 5 6 7 8 9 10 11 12 13 14 15 16 |
|
Note that the stack trace is generated at the moment when Vert.x detects that the threshold has been exceeded which is not necessarily the moment when the thread was actually blocking. In other words, it is probable but it is not guaranteed that the stack trace is showing the actual location where your event loop thread is blocking. You may need to examine multiple stack traces to pinpoint the right location.
You can tweak the watchdog check period and the warning thresholds. Here is an example:
1 2 3 4 5 6 7 8 9 10 11 12 13 14 15 16 17 18 19 |
|
Note that the first check is not executed right at the application start but is delayed by one check period. In our example the first check is executed 5 seconds after the application start followed by checks executed every 5 seconds. The concrete thresholds shown in the example worked well for one of my projects, however, your mileage may vary. Also, the very first execution of the handlers can be rather slow due to JVM class loading. Performance further improves when the JVM moves from interpreting the byte code to compiling it into the native code and running it directly on the CPU. Hence, you are more likely to hit the warning thresholds shortly after the application start than later on during the application run. It would be great if the threshold values could be dynamically adjusted to avoid the warnings before the JVM warms up. Unfortunately, there’s no way how to adjust the thresholds in runtime.
It goes without saying that Vert.x only checks the threads that were created as a result of calling Vert.x APIs. If you instantiate your own thread pool outside of Vert.x those threads won’t be checked. If you want Vert.x to check the threads in your custom thread pool, you can ask Vert.x to instantiate a checked thread pool for you like this:
1 2 |
|
The good thing about the blocked thread checker is that it is able to detect thread delays regardless of whether they were caused by a call to a blocking API or by executing a compute intensive task. As such it can serve as a good indicator that there is something seriously wrong with your application.
Inspecting stack traces
Some event loop delays can be so subtle that they can go unnoticed by the blocked thread checker. Imagine a situation where you have a handler that causes a very short delay. The blocked thread checker won’t catch this short delay because it is not long enough to reach the threshold. However, if this handler is called very frequently, the aggregate delay caused by this handler can have a great impact on the performance of your application. How to uncover this kind of issue?
A good option is to analyze Java thread dumps by hand. You can refer to this article if you want to learn how to do it. Alternatively, you can use a Java profiler like VisualVM to find out in what parts of your code the most processing time is spent. Instead of writing a long prose about how to use VisualVM to troubleshoot a Vert.x application, I created a short video for you. You can watch this demo using JMeter and VisualVM to figure out the cause of delays of the Vert.x event loop:
Conclusion
In this article, we talked about the blocked thread checker as a first indicator of the event loop delays. Next, I showed you in the video how to troubleshoot event loop delays in practice using VisualVM.
I hope that I didn’t scare you throughout this series by analyzing all the things that can go wrong when working with the thread model Vert.x is based on. In reality it’s not so bad. One just has to pay attention to the event loop model while coding. The awesome performance that Vert.x applications can achieve is definitely a sufficient reward for the extra effort.
If you got some battle scars while working with the event loop thread model in Vert.x, I would be interested in hearing your stories. Also, let me know if you found the video demonstration helpful or if you have suggestions for future videos. If you have any further questions or comments, feel free to add them to the comment section below.
 Read more about optimizing performance for the open-hybrid enterprise.